Overview
Identity fraud and scams remain some of the costliest threats facing consumers and financial services organizations today, with losses heightened by AI technology in the hands of fraudsters. Although fraud losses stabilized in 2025 after a sharp 19% rise in 2024 , consumer exposure to fraud is growing, trust is declining, and criminals are rapidly adapting their tactics and using artificial intelligence to exploit vulnerabilities in fraud detection, payments, and real-time scam detection.
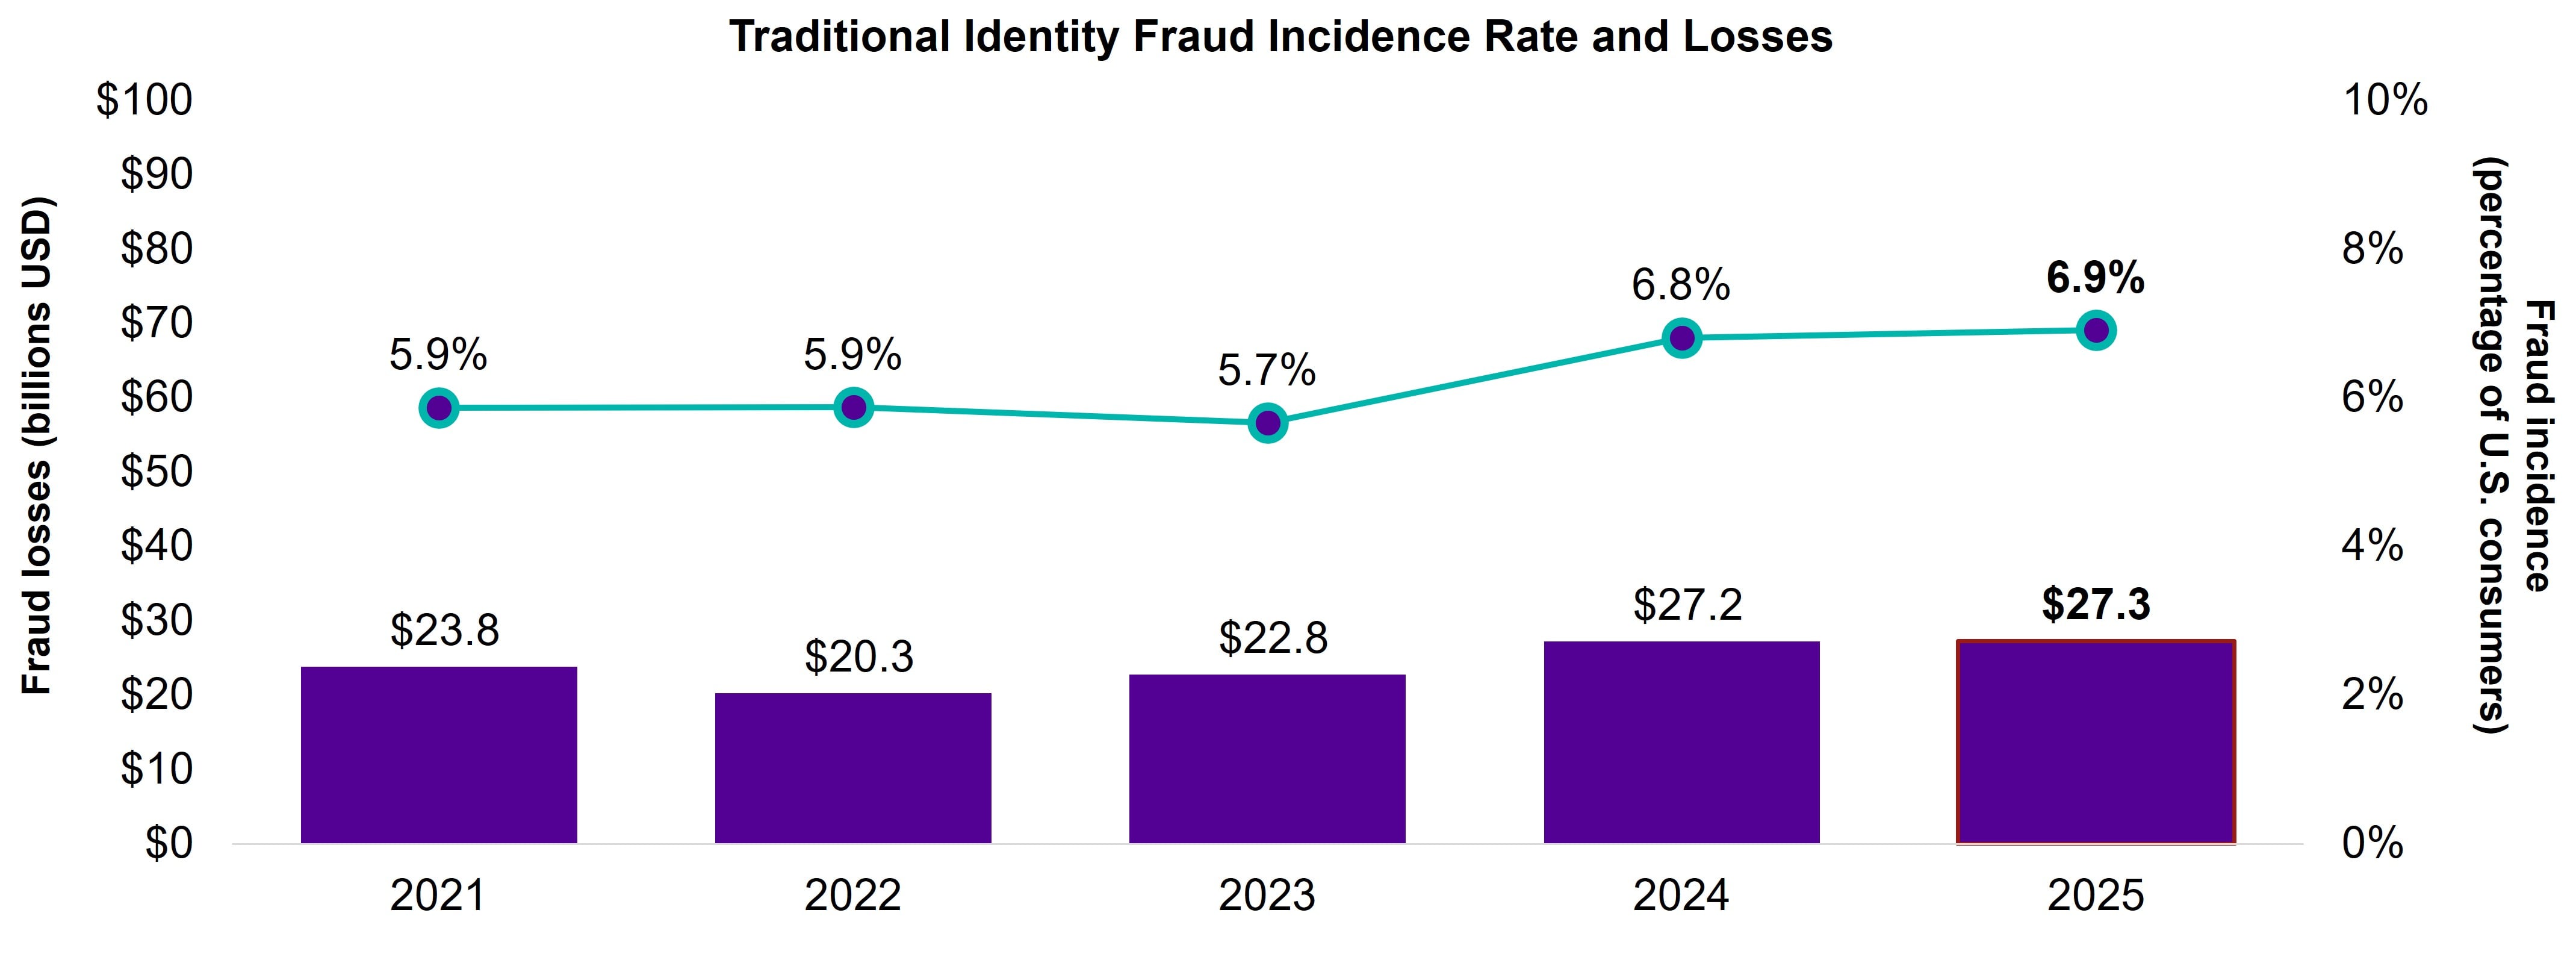
Traditional identity fraud losses remained steady at $27.3 billion in 2025, affecting 18 million victims. The number of victims increased across all fraud types in Javelin’s research scope, with new-account fraud experiencing the sharpest rise in number of victims, a 31% increase from 4.2 million in 2024 to 5.4 million in 2025. Account takeover, which makes up a part of both existing card fraud and non-card fraud, saw an 18% increase in victims from 5.1 million in 2024 to 6 million in 2025. Reduced losses do not translate to reduced risk.
Overall Identity Fraud Losses Level Off in 2025
Consumers spent an average of 10.4 hours resolving issues stemming from identity fraud in 2025, compared with 9.5 hours in 2023. Though Javelin did not track resolution hours in 2024, all fraud types have consistently grown longer in resolution times since 2022. Victims of account takeover and new-account fraud spent the most time resolving fraud, with ATO victims spending an average of 17 hours on their resolution and NAF victims slightly more at 17.8 hours.
Declines in overall scam losses, consumer impact, and average scam loss for victims suggest changes in tactics and industry efforts. Scams cost consumers just under $11 billion in 2025, a 45% decline in losses from 2024. Many factors play into such a significant decrease. Javelin has paid close attention to scam trends and consumers’ experiences with scam attempts over the past several years. Lines of questioning for scam victims are sharpened each year to deepen scam analysis and strengthen the industry’s understanding of the anatomy of scams, reflecting the dynamic nature of scams. The number of affected scam victims also declined 17% year over year, with about 19 million reporting scam incidents, down from 22 million in 2024. Additionally, the average amount stolen per scam fell 33%, from $868 in 2024 to $579 in 2025. Increased consumer awareness, organized industry task forces, and clearer scam definitions have contributed to the major reduction in scams.
2026 Identity Fraud Study Sponsors
The Javelin Strategy & Research 2026 Identity Fraud Study provides a comprehensive analysis of fraud trends amid a changing landscape for technology and payments. Its goal is to inform consumers, financial institutions, and businesses about the most effective means of controlling identity fraud.
The annual study began in 2003 and serves as the nation’s longest-running analysis of identity fraud, with more than 115,000 consumers surveyed. This study is independently produced by Javelin and made possible with support from the following sponsors:
Interested in sponsoring a future study?

Methodology
The Javelin Identity Fraud Study provides businesses, financial institutions, government agencies, and other organizations with an in-depth and comprehensive examination of identity fraud and the success rates of methods used for prevention, detection, and resolution.
Survey Data Collection
This ID fraud survey was conducted online among 5,010 U.S. adults over the age of 18; this sample is representative of the U.S. census demographics distribution. Data collection took place Nov. 10-Dec. 3, 2025. Data is obtained using 18-plus U.S. population benchmarks on age, gender, race/ethnicity, household income and region education, census region, and metropolitan status from the most current CPS targets with a variance of +-2% points. Due to rounding errors, the percentages on graphs may add up to 100% plus or minus 1%. To preserve the independence and objectivity of this annual report, the sponsors of this project were not involved in the tabulation, analysis, or reporting of final results. Figures in this report are rounded to one decimal place for presentation. Percentage changes are calculated using unrounded values and may not align exactly with displayed figures.
Make informed decisions in a digital financial world